

The State of the Housing Market in September 2023: A Comprehensive Analysis


Showings: A Slump in Activity
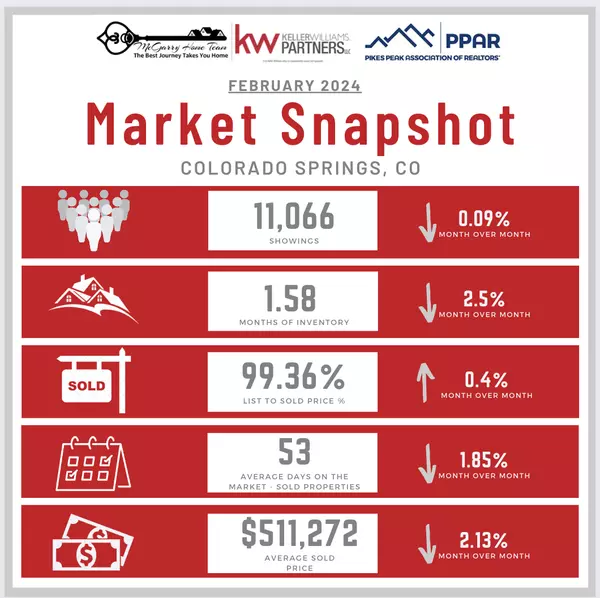
In September 2023, the housing market witnessed a total of 10,963 showings, marking an 11.51% decline from August. This decline could be attributed to various factors, including seasonal fluctuations, rising interest rates, or simply a temporary dip in buyer demand. However, it's important to remember that showings are not necessarily indicative of final sales, as other factors like negotiation and financing can come into play.
Months of Inventory: A Slight Increase
Inventory increased by 3.39% in September 2023, reaching 2.2 months of active inventory. This metric indicates how long it would take for all existing homes on the market to be sold if no new listings were added. An increase in months of inventory typically suggests a shift toward a more buyer-friendly market, giving potential homebuyers more options and potentially putting downward pressure on prices.
Listing-to-Sold Price Ratio: A Slight Downturn
The listing-to-sold price ratio, a crucial indicator of market health, experienced a minor dip in September. It stood at 99.3%, down 0.18% from August. This ratio signifies how close the final selling price is to the initial listing price. A ratio above 100% suggests homes are selling above their listing price, while below 100% indicates homes are selling for less. The small decline suggests a market that still favors sellers but may be slightly easing.
Average Days on Market: A Significant Increase
One of the most dramatic changes in the September 2023 housing market statistics is the average days on the market, which rose by a staggering 31.03% from August. Homes took an average of 38 days to sell in September, compared to just 29 days the previous month. This sharp increase indicates that properties are staying on the market longer, potentially due to decreased demand, increased competition, or a combination of factors.
Average Sold Price: A Mild Decrease
In September 2023, the average sold price for homes dipped by 2.36% compared to August, with the new average standing at $540,882. While this decrease is relatively modest, it could signal a cooling or stabilization of prices following a period of rapid growth. This change could be linked to the increase in days on the market and a slight shift in the supply-demand balance.
The housing market in September 2023 shows signs of moderate adjustment after months of frenzied activity. While showings have decreased, months of inventory have increased slightly, potentially providing more choices for buyers. The listing-to-sold price ratio has dipped slightly, but it remains favorable for sellers. The most significant shift has occurred in the average days on market, which increased substantially, indicating a potential slowdown in the pace of transactions. Finally, the average sold price has also seen a slight decrease, suggesting a possible easing of price growth.
It's important to remember that real estate markets can be influenced by a wide range of factors, including economic conditions, interest rates, and regional variations. As such, these statistics should be interpreted as a snapshot in time, and potential buyers and sellers should seek advice from local real estate experts for the most accurate and up-to-date information before making any decisions in the housing market.
Interested in Selling? | Interested in Buying? | Information on Investing
Categories
Recent Posts


"My job is to find and attract mastery-based agents to the office, protect the culture, and make sure everyone is happy! "